About a year ago, I ran a test comparing the performance of websites using Responsive Web Design (RWD) across different screen resolutions. The test consisted of loading the same RWD sites in Chrome using 4 different screen resolutions, triggering different “views” of the site, and comparing bandwidth and load times in each.
The test results didn’t bode well. They showed that practically all RWD websites downloaded the full payload of the desktop website regardless of what was displayed. These websites would download hundreds of KB of unnecessary data to a small screen, only to hide or shrink them on the client, resulting in abysmal performance on mobile devices.
Over the past year, RWD performance has been discussed at length, with great posts from Jason Grigsby, Tim Kadlec and many others. New tools such as PictureFill and Adobe Shadow make optimization and testing easier, and some of the conversation even made it into the HTML5 draft.
So, with all this progress, I figured it’s time for a retest – are we faster yet?
Quick Test Details
Similar to last year, I used http://mediaqueri.es/ as a repository of responsive websites. using WebPageTest, I loaded each of the 471 websites currently inventoried (an increase from 347 sites last year) in a Chrome browser, resized to one of 4 different screen resolutions each time. I then collected the results, and looked at the number of bytes needed to download each page in each resolution.
You can see more details on the test methodology in last year’s presentation, and can rerun the test on a given site with the instructions on this slide.
Problem Solved? Not really.
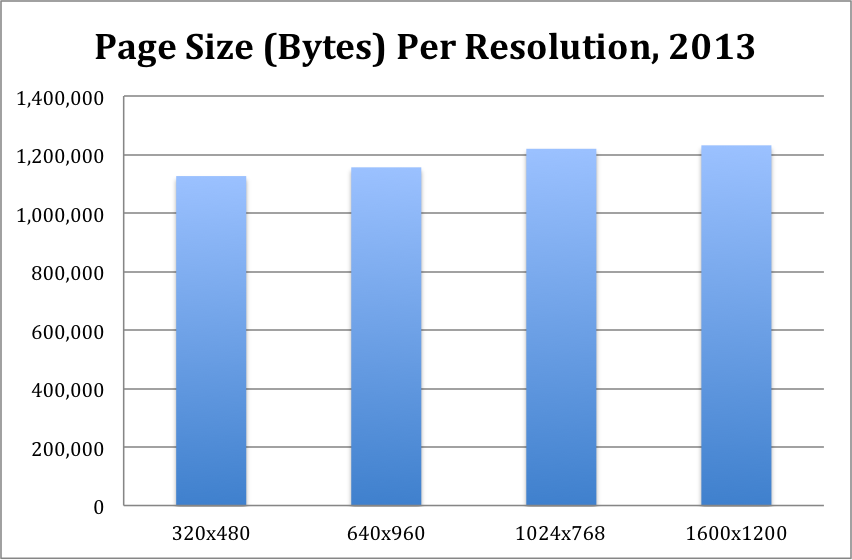
The results showed that, despite the better tools and conversation, most RWD websites still downloaded the full content of the page on every screen resolution. As you can see from the chart below, RWD pages loaded on the smallest screen were only 9% smaller than those on the largest screen (on average), despite huge differences in the amount of content shown and the physical size of images.
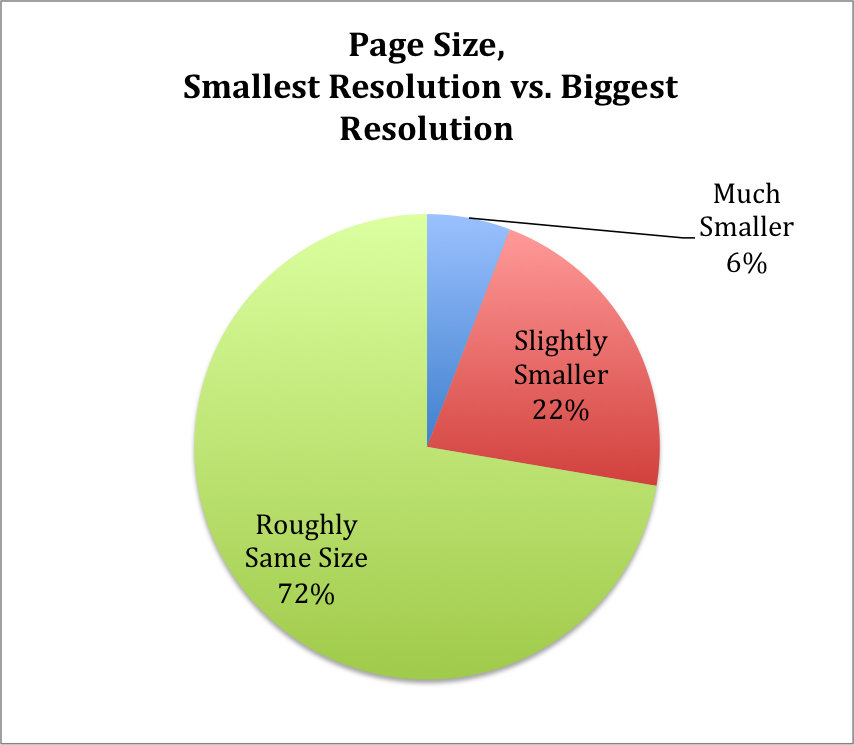
Looking across websites, less than 7% of websites were at least 2x smaller when loaded on the smallest screen compared to the biggest screen. Another 22% weighed between 50-90% of the large-screen page size when loaded on the smallest one, and the majority (72%) were roughly the same size on the smallest and biggest screens.
Not good, but better
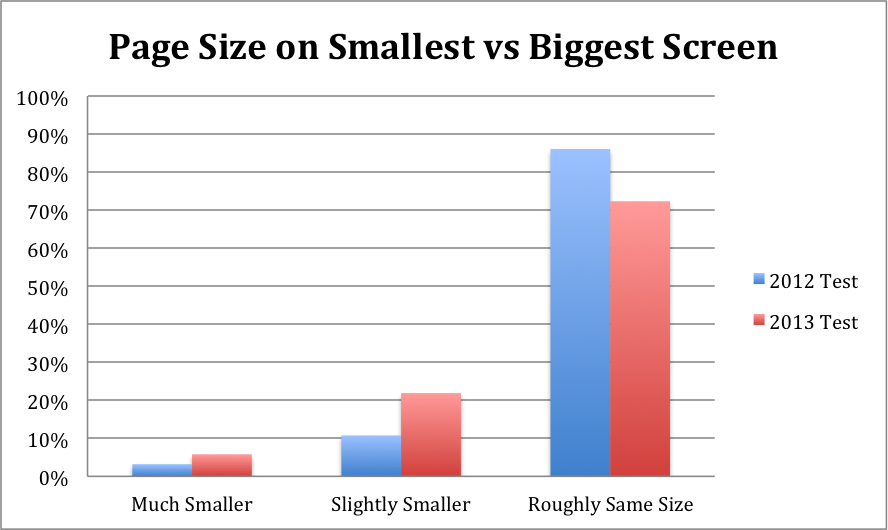
While these results are definitely not good, they’re still better than what we saw last year. As you can see in the chart below, the percentage of websites that are much smaller or slightly smaller in 2013 was double what it was in 2012. In addition, the average page in 2012 weighed only 6% less on a small screen than on a big screen, compared to 9% today – again a notable improvement.
This means the enhanced evangelism and improved tooling for RWD performance did have an effect, which is a significant achievement. That said, we probably need this growth to be exponential, not linear..
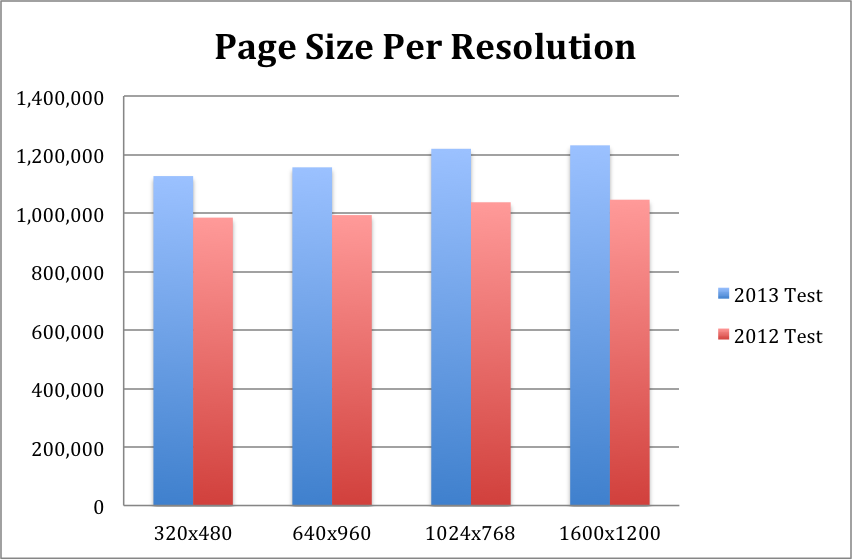
Unfortunately, while the cross-resolution page size stats improved, the overall performance did not. The HTTP Archive clearly shows how pages are constantly getting bigger, and this trend holds true for RWD sites as well.
The chart below (last one, I promise!) shows the average page size by window size. As you can see, the average page size has increased significantly across all the resolutions. Note that the sites included in each year’s averages are not exactly the same, but this trend holds even if we only look at the URLs shared across the two tests.
Summary
The bottom line is – our work is not done. We’re seeing some fruit of our performance preaching labor, but the vast majority of RWD sites still don’t devote enough attention (or time) to performance. As a result, if you happen to browse a responsive website on your smartphone, chances are it’ll be considerably slower than if you were browsing a dedicated mobile site.
We need to keep pushing and promoting RWD performance, keep building tools and making it easier to be fast, and find a way to improve RWD performance faster than the pace we make pages slower in general…
So for all my fellow performance enthusiasts out there, keep going, we’re not there yet!
Side Note: If you’re interested in the raw test data, you can download the detailed excel sheet with test results, pivot tables and links to the individual tests here.