Apple has always allowed only one browser rendering-engine on the iOS platform – the one included by default. Both the native browser (Mobile Safari) and the browser embedded into apps (UIWebView) use this engine. In addition, any alternate browser on iOS, most notably Chrome for iOS, must use UIWebView and not their own engines.
However, a browser is not just a rendering engine, and the iOS browsers still differ quite a bit. For example, Mobile Safari benefits from a JavaScript engine that is 3X faster than UIWebView. Chrome for iOS, in turn, uses a custom network layer designed to be as fast as the one used by Chrome for Android.
Still, because Chrome for iOS and Mobile Safari are both closed applications, we had no way of actually measuring their performance. We were limited to measuring using UIWebView within Mobitest, and had to assume the other browsers are faster. Fortunately, technology is always improving…
I’ve been working with Manish Lachwani, the CTO of a new startup called Appurify. He and his team have created a platform for automated testing and measurement of black-box apps, on real mobile devices. More specifically, the platform enables some probing into the internals of select apps, such as Mobile Safari and Chrome for iOS, and even lets one simulate network speeds and cellular conditions. Using this technology, we can finally compare the actual performance of these three browsers.
TL; DR;
Here’s a quick summary of the bottom line results.
Overall, Mobile Safari showed to be 18% faster than UIWebView on average. This is a respectable difference, but nowhere near the 3x difference in JavaScript benchmark results. The networking improvements included in Chrome for iOS narrowed this gap, making Chrome only 7% slower than Mobile Safari on average. Despite the small gap, Mobile Safari was consistently faster. It beat UIWebView on 88% of websites and Chrome on 72% of websites – though often by a small margin.
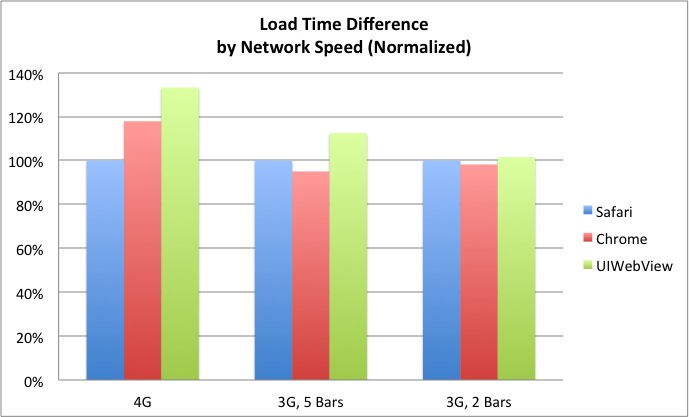
Network conditions significantly impacted the results. On a fast 4G connection, Mobile Safari’s lead grew to 33% faster than UIWebView and 18% faster than Chrome. A similar difference would probably be seen on a good WiFi connection. On the other hand, on a 2-bar 3G connection Mobile Safari was only 2% faster than UIWebView, and it was 2% slower than Chrome. On the average network tier (3G, 5 bars), Chrome beat Safari on 58% of websites, by an average of 5%.
A few key takeaways from these results are:
- There is a real, quantifiable difference between Mobile Safari and UIWebView-based browsers.
- However, in real world cellular network conditions, the difference between the browsers on iOS is not huge.
- The networking layer in Chrome makes a real difference, especially in less than ideal network conditions.
- The small delta implies using UIWebView-based tools, such as Adobe Shadow, Mobitest, and MIHTool, maintains a decent approximation for the performance Mobile Safari would show, especially under average or poor network conditions.
Short history lesson
About 2 years ago, as part of iOS 4.3, Apple introduced some major improvements to its native browser, Mobile Safari. The most well known improvement was Nitro, an improved JavaScript engine that performs Just-In-Time compilation, making JS dramatically faster.
Unfortunately, apps did not benefit from these improvements. Apple did not include Nitro (and other optimizations) in its embedded browser, UIWebView. Apple stated this was due to security concerns, while others voiced conspiracy theories about Apple crippling HTML5 apps.
Whatever the reason, the embedded and native browsers were not equals, and are still not equal today. When Blaze, my previous company, compared browser performance between iOS and Android, Apple even explicitly stated that the embedded browser does not represent the native browser, due to these missing optimizations.
What the Benchmarks said
Based on benchmarks, the impact is dramatic. JavaScript Benchmark such as SunSpider are 3x faster on MobileSafari compared to UIWebView, implying that browsing a page inside your Twitter or Yelp app would be painfully slow.
Real websites, however, are not benchmarks. We already know that hardware improvements impact benchmarks more than page load times, and can expect the same to be true in this case. In addition, cellular performance isn’t all that great, and if the network is the bottleneck, browser differences may have less of an impact.
Luckily, we’re now able to test these expectations using Appurify, and compare actual load times of real web pages on the different browsers. Let’s get to the results.
Comparing Averages
On average, Mobile Safari was just a little bit faster. When averaging all network speeds, it was 18% faster than UIWebView and 7% faster than Chrome for iOS.
When comparing MobileSafari with UIWebView, there was a clear trend – the slower the network, the smaller the gap. Safari’s lead went from 33% to 12% to 2% as network speeds decreased. This makes sense to me – as the network gets slower, the bottleneck becomes mostly moving bits up and down, and optimizations like a faster JavaScript engine don’t help as much.
The comparison with Chrome for iOS was a bit murkier. Mobile Safari was 18% faster on the 4G network, but it was 5% slower under the 3G 5 bars conditions. The most likely explanation is that Chrome’s touted network layer shines under such conditions. When looking at the poor network conditions case, the delta shrunk, but Chrome was still 2% faster than Mobile Safari.
How did Mobile Safari compare to other browsers?
| Mobile Safari vs… | 4G Speed | 3G, 5 Bars | 3G, 2 Bars |
|---|---|---|---|
| UIWebView | 33% Faster | 12% Faster | 2% Faster |
| Chrome for iOS | 18% Faster | 5% Slower | 2% Slower |
Safari Consistently Faster
Mobile Safari also outdid the other browsers in the vast majority of tested URLs. Compared to UIWebView, mobile safari was faster in roughly 4 out of 5 sites in the top two speeds, and 3 out of five in the poor network test.
On the top network speed, Mobile Safari also beat Chrome in 80% of cases. However, repeating what we’ve seen in the averages, Chrome did better under worse conditions, and was faster on 58% of websites in both the middle and bottom network speeds, even if the win was usually by a very small margin.
On how many websites was Mobile Safari faster?
| Mobile Safari vs. | 4G Speed | 3G, 5 Bars | 3G, 2 Bars |
|---|---|---|---|
| UIWebView | 86% | 79% | 58% |
| Chrome for iOS | 80% | 42% | 42% |
How often did it really matter?
Realistically, a 1-2% difference matters very little. If Safari was consistently 2% faster than Chrome, few would call it a faster browser. So, I took a look at how often was the gap between the browsers significant, defined as a 10% or bigger load time delta.
Compared to UIWebView, Safari was much faster when the network was good. An impressive 70% of websites loaded significantly faster on Safari, usually by a gap of 20% or more. Safari was often much faster on a good 3G connection too, but on a bad connection the delta was harder to notice.
When comparing to Chrome, the results repeated the previous pattern. On a good connection, Safari was significantly faster on 60% of websites. That stat dropped to 10% on average conditions, and climbed back to 23% on poor network speeds.
On how many websites was Mobile Safari significantly (10%+) faster?
| Mobile Safari vs | 4G Speed | 3G, 5 Bars | 3G, 2 Bars |
|---|---|---|---|
| UIWebView | 70% | 39% | 17% |
| Chrome for iOS | 60% | 10% | 23% |
On the flip side, Chrome also beat Safari by a large margin in a decent number of cases – 29% under poor conditions, and 16% under average conditions. Under good conditions, only 10% of websites loaded much faster on Chrome.
UIWebView beat Safari by a significant difference in less than 10% of tested sites, less affected by network speed.
On how many websites was Mobile Safari significantly (10%+) slower?
| Mobile Safari vs | 4G Speed | 3G, 5 Bars | 3G, 2 Bars |
|---|---|---|---|
| UIWebView | 8% | 7% | 9% |
| Chrome for iOS | 10% | 16% | 29% |
Conclusions
My first conclusion is that the delta between UIWebView and Safari is smaller than I thought. Especially under less ideal network conditions, which is when users feel the most pain, UIWebView and Mobile Safari don’t differ much.
Being a big advocate for speed, though, my second takeaway is that this difference is still real and interesting. Especially under good conditions, Mobile Safari is truly faster. This means I still wish Apple would put Nitro and the other optimizations into UIWebView, and believe users would appreciate that.
My third takeaway, and the one I was most surprised to see, is how big of an impact the Chrome networking layer made. Chrome for iOS, despite being built around UIWebView, managed to significantly shrink the gap with Safari – and even beat it often enough. While I can’t say Chrome for iOS is faster than Safari, these numbers make it hard to say it’s slower. This is doubly impressive when you consider this test doesn’t capture some of the predictive optimizations Chrome employs when repeatedly used by real users.
My last conclusion is that the difference is small enough to feel comfortable using UIWebView based tooling. The world of Mobile painfully needs more tools for debugging and testing websites, and these tools only have UIWebView available to them.
Given the results of this study, I believe the browser performance in tools like Adobe Shadow, Mobitest, MIHTool and others is a close enough approximation of Mobile Safari to safely use. This is especially true in poor network conditions, and mostly true in average scenarios, which are the cases where performance matters the most.
Before signing off, I’d like to give another shout out to Appurify, for providing the technology needed to run these tests. They look like a very promising startup, and their platform makes previously complex test cases very feasible. I’d strongly encourage anyone dealing with Mobile to give them a try.
Appendix: Detailed Testing Methodology
As always, I try to be completely open about how I ran my tests. There is no such thing as a perfect test, but by sharing the details you can see any possible bias and use your own judgment on whether you should trust the results or not.
Using Appurify, I measured the page load times of the top 500 websites in the US (per Alexa) with each of three main iOS browsers (Mobile Safari, UIWebView and Chrome for iOS) under three different simulated cellular network speeds (3G 2-bars, 3G 5-bars, 4G LTE). All tests were run using an iPhone 5 running iOS 6.1.2, and were run in portrait mode from San Francisco.
The test flow was as follows:
- For each network speed - For each URL - For each browser - Load the browser with an initial test URL (to avoid capturing app load time)
- Load the URL being tested (start the timer)
- Poll the browser every ~30ms to see if it completed loading
- Once the page is loaded, stop the timer and log the time.
- Navigate to the test URL again, clean all caches, cookies, history, etc
- Exit the browser
For each browser, each URL was loaded 7 times, and I used the median load time of those for subsequent calculations. Note that the 30ms interval isn’t always perfect, as timers may invoke a few milliseconds later than planned.
Once I had the per browser data, it seemed obvious that sometimes the browsers did not load the same page. The most common reason was that the page was broken on one or both of the non-safari browsers. Page Size was a pretty good indicator of whether the same page was loaded on multiple browsers, so I only used the URLs where the page size was similar (within a 10%) across all browsers.
The odd broken tests and these filters reduced the dataset to 318 URLs. Furthermore, all the averages mentioned above are calculated while ignoring outliers – the top 5% of tests. Without ignoring outliers, a handful of timeouts and extreme cases threw off the numbers. After ignoring the outliers, the median and averages were very close to each other, and could almost be used interchangeably.
Note that when I compared sites across network conditions, I used the average page load time on each browser (across network speeds), and compared them to each other. This means if a site was much faster under a certain network speed, and a bit slower in other two, it may still be marked as faster overall. This approach isn’t more or less accurate than another, but it’s still worth clarifying.
The last detail to share is the exact network speeds used in this study. I throttled network speeds down to maintain a consistent speed for benchmarking, and used the network speeds that Appurify classifies as Verizon’s averages in different conditions (for San Francisco). Here are the technical details about those speeds:
- 3G, 2 Bars: 193/100 Kbps down/up, 331ms latency
- 3G, 5 Bars: 902/712 Kbps down/up, 150ms latency
- 4G, 5 Bars: 6.8/4.9 Mbps down/up, 29ms latency
If you’re interested in the raw data (they’re slightly complex), you can download it here.